A busy trading floor was experiencing difficulties with their six air handling units, which were fed from a single 480V, 400-amp service. The units were malfunctioning, stalling and at times were unable to start, causing the temperature in the control room to rise to unacceptable levels. A Dranetz Power Platform PP4300 was installed for a two-week period to evaluate the voltage and current of the 400-amp service feeding the handlers.
Based on the collected data, we learned the following:
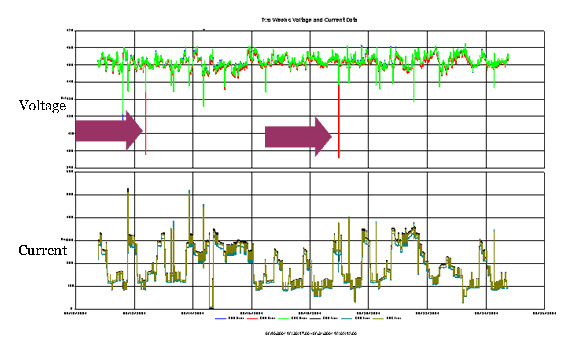
- The top graph shows the voltage, which averages about 450V as opposed to the 480V expected. This resulted in a continual undervoltage situation, putting the system at a higher susceptibility for sags.
- Three large sags, greater than 10% of nominal occurred (see purple arrows), and numerous sags at around 5% of nominal.
- The lower graph shows the current, expected to be 400 amps. As you can see, on numerous occasions it rose above 400 A, and in several cases rose to 500 A.
- The current rise can be correlated to voltage sags.

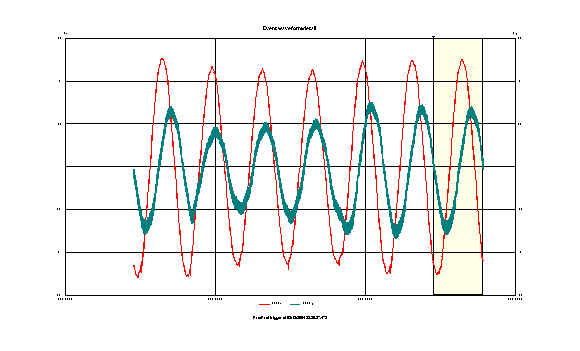
In the above, we see that the voltage (in red) and the current (in blue) are both decreasing, indicating that the source of the sag can be found upstream of the monitoring point (PQ Rule #1). As a result of this survey, two of the air handlers were moved to a different service, eliminating an overloaded circuit condition and a source for voltage sags.


