A midwest utility was receiving complaints of annoying light flicker from an entire neighborhood.
When the utility connected a power monitor to the 240-volt distribution bus the problem was quantified. The RMS Voltage event summary, Figure 1, indicates the bus voltage was essentially constant until a load was applied which caused the RMS voltage to oscillate between 228 and 242 volts.
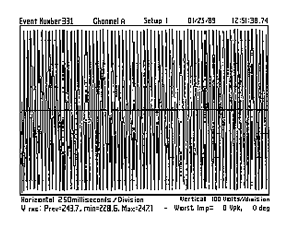
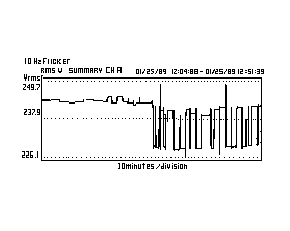 Figure 2 shows 64 cycles of the 240-volt waveform during the disturbance period. It is almost impossible to analyze the small voltage variations from this diagram. Expanding the waveform around the peaks of the sine wave clarifies the situation.
 In Figure 3, it is evident there are alternatively three low voltage cycles followed by three high voltage cycles, for a flicker frequency of 10 Hertz. This flicker frequency can be determined by properly positioning the cursors as shown here, or by simply dividing 60 Hertz by six.
Waveform expansion permits examination of peaks of cycles shown in previous figure. These are sine waves, although they don’t appear to be so.
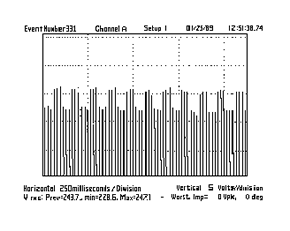 During this period the voltage variation was approximately 4 volts. The ability of the power monitor to capture 64 cycles and to allow examination of peak amplitude changes by expanding the waveform made this analysis possible.
IEEE Standard 519-1981 indicates that human eye sensitivity to voltage flicker peaks at about 10 Hertz, thus accounting for customer annoyance.
Investigation revealed that the voltage variation was caused by a malfunctioning continuous welder within the service area. The welder was operating on an incorrect duty cycle: three cycles on, three cycles off.
Welder duty cycle was corrected so voltage variations did not create an annoying flicker frequency.