An administration building in a government complex in New Jersey had a transformer with a 4KV primary, 120/208V wye, 800A secondary. The buss duct ran up to a second floor panel, which supplied an office area.
Computer misoperations and lights flickering were occurring randomly for nearly two years. Emergency lighting was also flickering.
Three voltages and corresponding currents were monitored at the second floor panel for three days. During this time, two types of power quality phenemona were observed: sags and voltage fluctuations. Figure 1 shows a time plot of several of the sags. What appears to be the first sag at 14:00 is actually a series of nine sags.
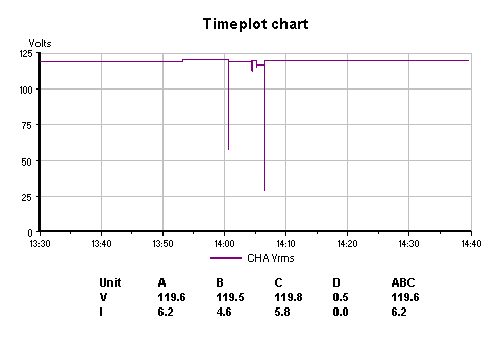
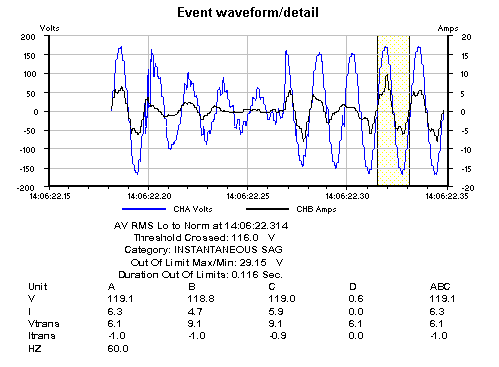
The most severe sags were to 57 and 76 volts, both for 3 cycles. The voltage and current waveforms for the 57 V sag are shown in Figure 2. Note the RMS of the current reduced during the intial part of the sag, then swelled as the voltage returned to normal.
The second sag shown on the timeplot is a more severe sag, lasting seven cycles and having a minimum RMS value of 29 Vrms, as shown in Figure 3.

The other PQ phenomena observed were RMS voltage fluctuations, as can be seen in Figure 4. If you connect the negative peaks of the voltage together (red line), you will see that it produces a low frequency curve of its own.
Impedance Analysis
The source and load impedance calculations for Channel A shown in Table 1 did not show any abnormal results. Though the approximated source impedance was a little on the high side, the results were what one would expect in this type of environment.
| Voltage | Current | Lead Z | Delta V | Delta I | Source Z |
|---|---|---|---|---|---|
| 114.63 | 4.33 | 26.5 | 3.52 | 0.29 | 1.28 |
Sag Analysis
Three of the sags observed during the monitoring period were significant enough to cause equipment mis-operation (depending on the actual susceptability of the equipment.) All three of the sags appear to be coming from the source, not the load, relative to the monitoring point. The source, in this case, was towards the electric utility: from the breaker panel, back down through the buss, to the transformer. This was determined because no large increase in current was noted when the sag began. In addition, the current decrease for the first couple cycles, followed by a slight swell. This would be consistent for loads of rectified-input, switched-mode power supplies (as found in most electronic equipment, such as PCs) and fluorescent lights found in an office complex.
Flicker Analysis
Figure 4 shows the variations of the voltage of channel A often referred to as voltage fluctuations. When the frequency of this modulation is below 30 Hz, the human eye can perceive such as light flicker, depending on the percent fluctuation. The 8% modulation of Channel A is around 10 Hz, and is very near the most perceptible point for the human eye (0.25%variation at 8.8 Hz).
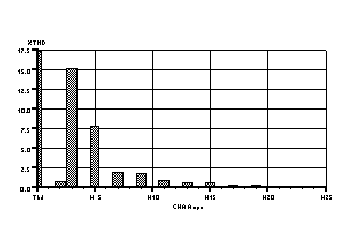
Harmonic Analysis
The following harmonic analysis in Figure 5 is very similar to that for fluorescent lighting, where the third harmonic is the largest component, the 5th is half of the third, the 7th and 9th are one quarter of the third, and the 2nd is slightly smaller than the 7th.
Rectified-input, switched mode power supplies will also contribute signficant odd harmonics, in a 1/h amplitude ratio (where ‘h’ is the harmonic number).